GPS/Map View #
Navigate the Map: #
- Drag to Move: Click and drag the map image to position it as needed.
- Zoom Control: Utilize the center scroll wheel or perform a double-finger drag on a trackpad to adjust the zoom level.
Map Configuration: #
- Load a Map: Go to the windows menu bar and Navigate to
Edit > Map Config > Load Map Configto load a satellite image onto the map view, along with any saved markers. - Save a Map: Save your current map configuration, including markers, by accessing
Edit > Map Config > Save Map Config. - New Map: Clears all track markers and removes track map. See Setup Track Map for instructions on creating a new track map.
- Unlock Map Markers: Functionality to be implemented.
Check out this PAGE for more information on setting up the map.
Map View Menu: #
- Access Menu: Right-click on the map view to reveal the menu.
- Change Map Settings: Click on “Map Settings…” to customize various map parameters.
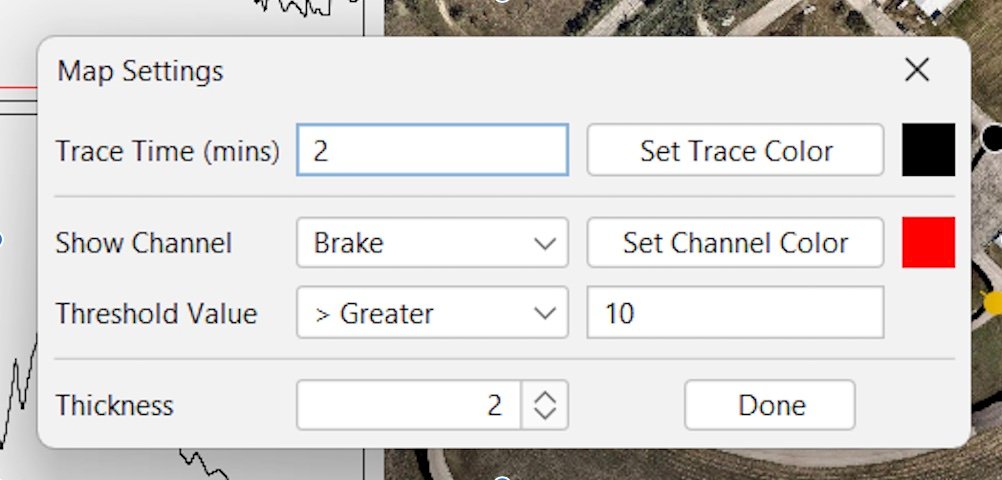
Map Settings: #
- Trace Time: Adjust the visibility duration of the car trace. Align it just below the lap time for timely disappearance. Or set it longer to compare lines from lap to lap.
- Trace Color: Customize the color of the car dot and its trace.
- Show Channel Display and Set Channel Color: Select and contrastively colorize channels like TPS, Brake, and Lateral G force for better visualization.
- Threshold Value: Establish thresholds for channel values and assign corresponding colors.
- Thickness: Set the thickness of the car trace for enhanced visibility. Set between .5 and 5.
Example: If you set Brake > 10 and the color to red, every time the Brake channel exceeds 10 the trace will turn red.

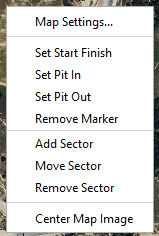
Marker Management: #
- Add Markers: Set Start Finish, Pit in/out, or Add Sectors. Refer HERE for additional resources for comprehensive marker setup guidance.
- Remove Marker: Eliminate non-sector markers by selecting the respective red box.
- Move Sector: Drag sector markers to new positions for adjustment.
- Remove Sector: Delete sector markers by clicking on the corresponding red box.
- Center Map Image: Re-center the map image to the initial right-click position. Adjust the zoom setting if necessary.
History Graph View #
Overview #
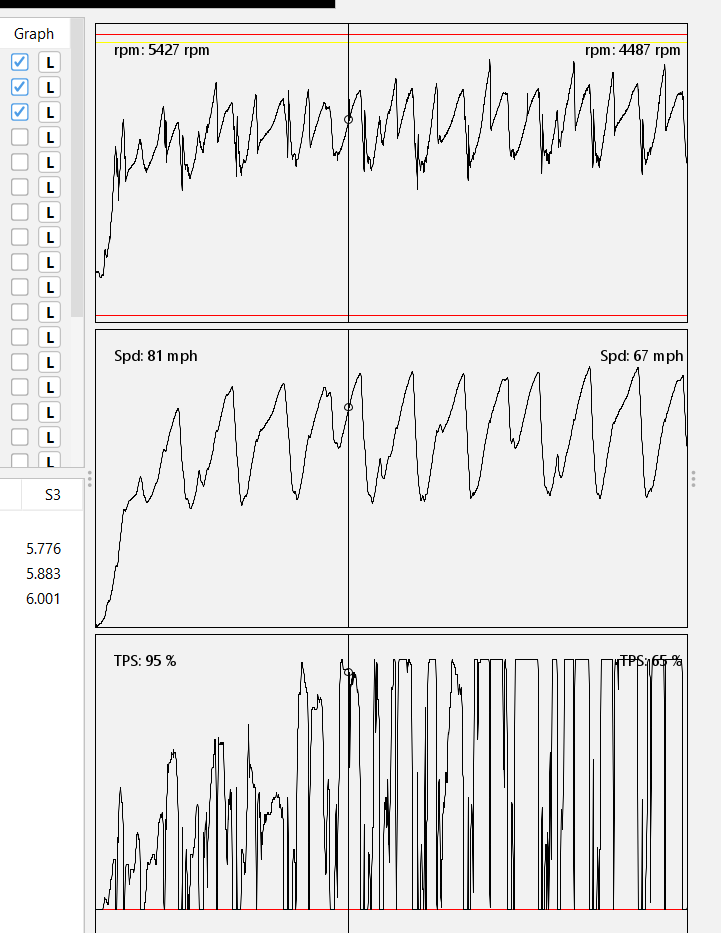
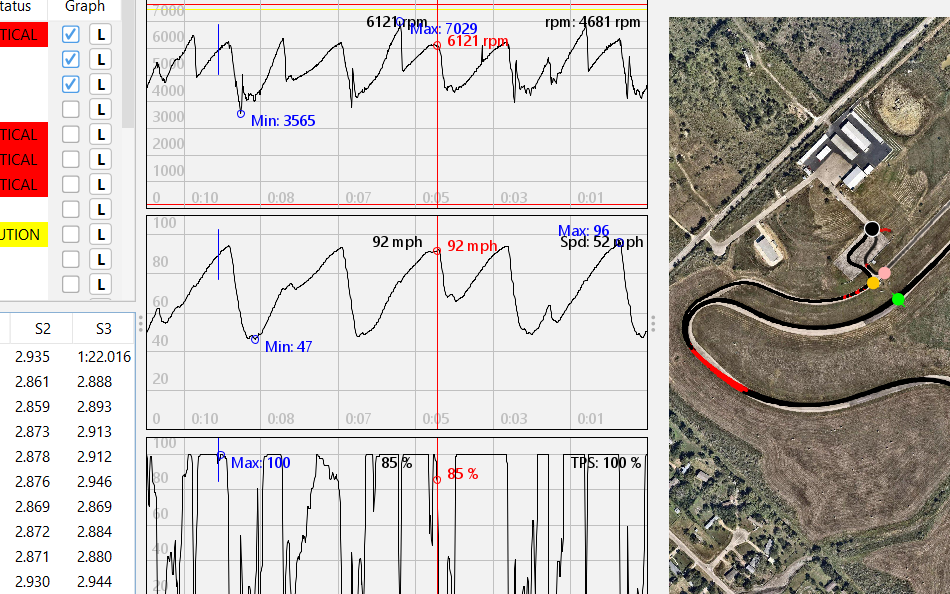
Graphs of three channels can be displayed here. Which channels displayed is controlled by clicking the box in the graph column of that channel in the Channel view (see Channel view section below).
- Limits: Display limits and Critical/Caution limits are set when you set up the CAN ids in the Car configuration set up. You can also adjust this limit in the Channel view (see next section). Current Critical/Caution limits are shown with red and yellow lines on the graph.
- Current value: The upper right corner of the graphs shows the current value transmitted from the car.
- Historical value: Drag the mouse over the graphs and a vertical line will appear. In the upper left corner of the graph a value will show where the vertical line intersects the data on the graph.
- Lap compare: You can also overlay previous lap’s data with the current lap. See the Lap/Sector view section for instructions on how to do this.
Graph Features #
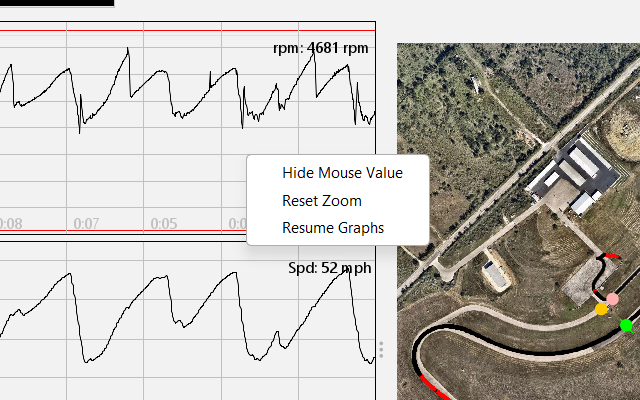
Right Click to get menu.
- Show mouse value: Turns on a feature that will show the value on the graph at the mouse location as well as a min and max value 30 seconds either side of the mouse.
- Hide Mouse Value: Hides above information and gives the default view.
- Reset Zoom: Use the mouse track wheel or zoom feature of your track pad to zoom in and out of the graph view. Reset will show default zoom value.
- Pause Graphs: Pause the time motion of the graphs.
- Resume Graphs: will start the time of the graph at the current time.
Channels View #
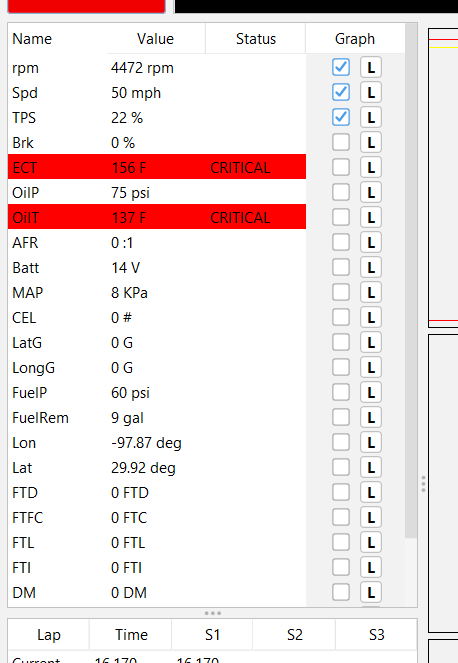
The Channels view Shows information about each channel that was created from the CAN messages in the Car Config section (HERE). A default order is applied during program startup with car critical channels being listed first. The order can be customized by click dragging the row to the desired position.
- Name: This is the “Short Name” of the channel set in the car configurator.
- Value: This is the current data being transmitted from the car.
- Status: Blank means data is within Critical/Caution limits. “CAUTION” means that the data has exceeded a caution limit. “CRITICAL” means that the data has exceeded a critical limit. The row color also changes when a critical or caution limit is exceeded.
- Graph (empty Box): This column controls information seen in the History Graph view. Clicking the empty box will display that channel in the History Graph view. Only the first three channels selected will be displayed.
- Graph (“L” box): Clicking this box will open a window that will allow you change the display and critical/caution limits in the History graph view. This will also change when you get warning messages in the Warning display, so be careful what you set these too.
Lap/Sector View #
Overview: #
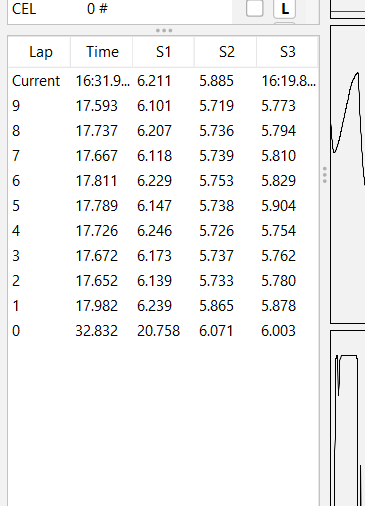
This section displays lap times and sector times. These times are determined from the markers created in the GPS/Map view.
- Lap: This column shows current lap and previous lap numbers.
- Time: In the current row this is the running lap time. All other rows show that lap’s lap time.
- S1, S2, S3….etc: In the current row it shows the running sector time. In all other rows it shows that sector’s time.
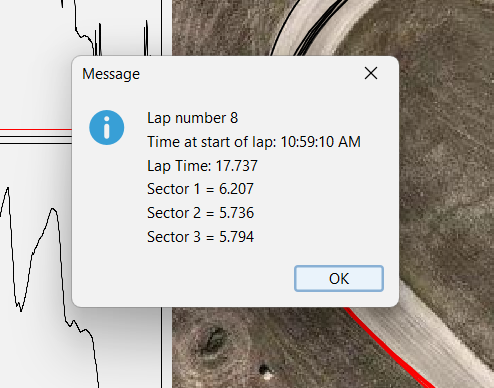
Lap Summary Data: #
Click the appropriate lap number and a window will display summary data.
Lap Data Overlay/Compare: #
Click the lap time box for the lap you want to compare. It will display that lap’s channel data in the History graph view in a contrasting color. The current lap will be traced in a black line. Multiple laps can be overlaid. They will all be a different color. To clear the overlaid data from the History graph, click the current lap’s time box and the graphs will go back to the standard History graph.
Warning Display #

Overview: #
This view will alert the user when Critical and/or Caution limits are exceeded. The limits are set in the Car Configurator (instructions HERE) and can also be adjusted in the Channel view panel (see above). Once a limit is exceeded, the large button on the left will change color (red for critical warnings and yellow for caution warnings). A message will appear in the window to the right of the button telling you what channel has exceeded a limit, what the limit is and the value when the limit was exceeded. In the case of multiple warnings, critical messages are listed first and cautions second.
Clearing Warning Messages: #
Warning message will stay displayed until BOTH of the following conditions are met. The channel’s current value is below/above the exceeded limit AND then warning button is clicked.
Flagtronics Display #
Flagtronics: #
If you have a Flagtronics unit in your car and it is connected to the CAN bus network that the RaceRX unit is connected to as well, whatever is displayed on the car Flagtronics unit will display in this window as well.
To setup Flagtronics to communicate with RaceRX visit this page [HERE].
Driver Messages #
The RaceRX system includes a backup communication channel to conventional radios, allowing a separate line of communication between the pit crew and the driver.
The driver can send pre-set messages to the Crew Chief software by pressing one or more of the buttons on the car’s unit box. These messages will appear in the Flagtronics display area. The available messages are:
- Pit: Notifies the pit crew that the driver is coming into the pit.
- Radio: Alerts the pit crew that the driver is experiencing radio issues.
- Check Car: Informs the pit crew to check the car for potential issues.
For more information on how the Crew Chief software can send messages to the driver, visit this page [HERE].